
India’s Fabric Exports Face A Colour Test
By Henry Dsouza
After a strong 2025, India’s dyed and printed fabric exports lost momentum in the first-half of 2026. Printed products held up better than dyed fabrics, but a weaker second quarter sharpened the challenge of sustaining overseas sales.
The value of a fabric is shaped well beyond the loom. Colour, pattern and finish help determine its appeal to a buyer, while consistency influences the next order. India’s latest export figures place that part of the textile value chain under scrutiny: a strong year of growth has given way to a more demanding market.

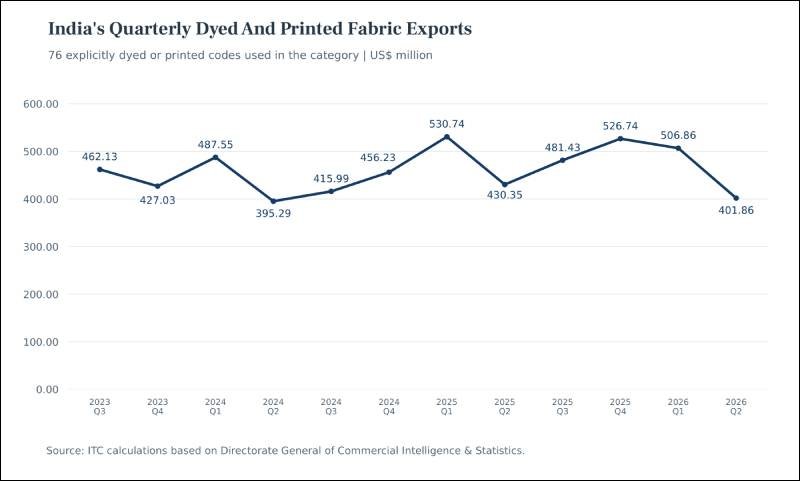
Exports across the supplied six-digit categories explicitly identified as dyed or printed reached US$ 908.72 million in January–June 2026, down 5.45% from US$ 961.09 million a year earlier. The decline followed a 12.20% increase in calendar 2025, when shipments rose to US$ 1,969.26 million from US$ 1,755.06 million in 2024.
The distinction between these figures and the larger headline basket matters. The supplied fabrics overall total includes unbleached and bleached fabrics, denim, fabrics made from yarns of different colours and categories that do not distinguish processing status.
A stronger year gives way to a weaker quarter
The first-half decline became more pronounced in April–June 2026. Exports in the focused basket fell to US$ 401.86 million from US$ 506.86 million in January–March, a sequential contraction of 20.71%. When compared with April–June 2025, the decline was 6.62%.
The international backdrop was also subdued. Worldwide exports across this commodity fell 4.26% to US$ 24,780.90 million in the first half of 2026. India’s share slipped from 3.71% to 3.67%. Its contraction was therefore somewhat steeper than the corresponding global decline.
The quarterly direction offers a further point of comparison. Global shipments across this commodity increased between January–March and April–June 2026, while India’s fell. The figures establish a loss of momentum in export value; without comparable volume and unit-value data, they do not establish whether these reflected fewer metres shipped, lower prices or a different product mix.
Printing shows greater resilience
Printed fabrics provided the more resilient part of India’s performance. Their export value eased 1.60% to US$ 439.04 million in January–June 2026, compared with an 8.79% decline in dyed fabrics to US$ 469.68 million. Printed products consequently accounted for 48.31% of the focused basket.
This followed a particularly strong 2025 for printed fabrics, when exports increased 22.12% to US$ 945.36 million. Dyed fabric exports grew a more modest 4.38% to US$ 1,023.90 million. Printing’s stronger annual performance carried into a smaller first-half decline, although its April–June shipments still fell sharply from the preceding quarter.
The distinction matters commercially. Treating all coloured fabric exports as a single market would conceal different movements in dyed and printed products. The data supports a more selective reading of demand, rather than a uniform assessment of processing exports.
Cotton remains central but performance varies
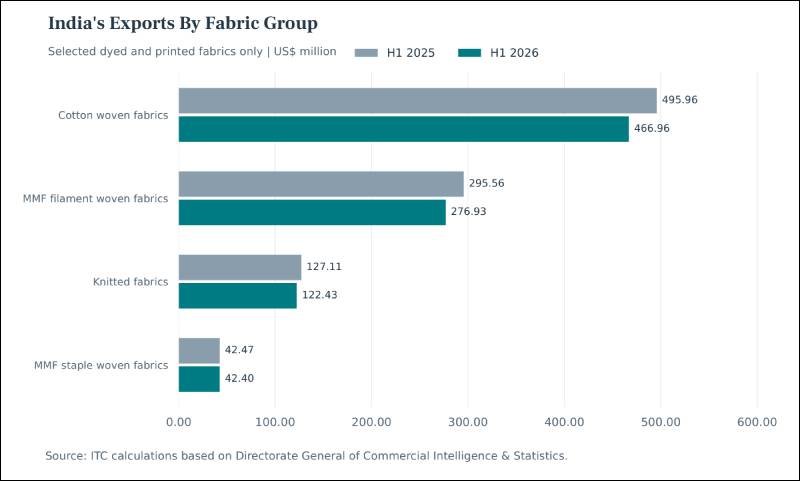
Dyed and printed woven cotton fabrics in Chapter 52 remained the largest component, contributing US$ 466.96 million in January–June 2026, or 51.39% of the focused basket. Their value fell 5.85% from a year earlier, following 13.48% growth in 2025.
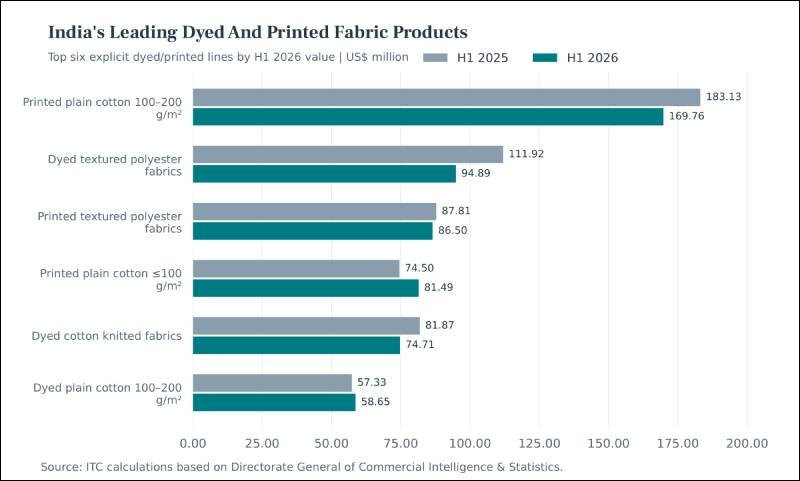
Printed plain cotton fabrics weighing more than 100 g/m² and up to 200 g/m² under HS 520852 were the largest individual export line in the focused basket. Shipments reached US$ 169.76 million in the first half, down 7.30%. This category had generated US$ 410.63 million in 2025, an increase of 18.38% over 2024.
Lighter printed plain cotton fabrics under HS 520851 moved in the opposite direction, rising 9.38% to US$ 81.49 million in the first half of 2026. Other printed cotton fabrics under HS 520859 also advanced, gaining 14.69% to US$ 24.44 million.
Dyed cotton presented similar contrasts. Plain dyed fabrics in the 100–200 g/m² weight range under HS 520832 increased 2.30% to US$ 58.65 million, while the lighter plain dyed category under HS 520831 declined 24.03% to US$ 29.18 million. The divergence suggests that fibre alone is too broad a guide; fabric construction, weight and processing category produce quite different export results.
Man made fabrics offer pockets of growth
Explicitly dyed and printed man-made filament woven fabrics in Chapter 54 recorded exports of US$ 276.93 million in January–June 2026, down 6.30%. Dyed textured polyester filament fabrics under HS 540752 declined 15.21% to US$ 94.89 million, while their printed counterpart under HS 540754 eased 1.50% to US$ 86.50 million.
Other categories showed greater strength. Dyed synthetic filament fabrics under HS 540792, excluding those mixed principally or solely with cotton, increased 20.08% to US$ 28.03 million. Their growth demonstrates that the wider decline did not extend to every synthetic fabric line.
The selected dyed and printed staple-fibre woven fabrics in Chapter 55 were almost unchanged at US$ 42.40 million. Comparable knitted fabric categories in Chapter 60 declined 3.69% to US$ 122.43 million. Within knitting, dyed cotton fabrics under HS 600622 fell 8.75% to US$ 74.71 million, whereas dyed synthetic fabrics under HS 600632 increased 2.30% to US$ 13.56 million.
Established markets remain important
The supplied destination chart provides a wider view of India’s fabric trade, covering the full basket rather than the 76-code dyed and printed subset. On that broader basis, Bangladesh remained the largest destination in January–June 2026 at US$ 371.12 million, up 5.01%. Sri Lanka followed at US$ 201.25 million, down 8.60%.
Shipments to the United Arab Emirates declined 34.04% to US$ 135.59 million, while the United States recorded a 15.49% fall to US$ 119.86 million. Indonesia and Egypt registered increases of 18.79% and 18.64%, reaching US$ 42.28 million and US$ 38.02 million, respectively.
These figures identify stronger and weaker destinations across the wider fabric basket. They cannot establish destination rankings or growth rates specifically for dyed and printed fabrics; that requires a matching country breakdown for the focused codes.
Connecting imported chemistry with export performance
The companion report on imports shows a different direction at the input end of the chain. India’s imports of textile finishing preparations under HS 380991 increased 22.98% to US$ 44.73 million in January–June 2026. Yet exports in the explicitly dyed and printed fabric basket fell 5.45% over the same period.
The contrast is commercially relevant, but it is not evidence of a direct conversion shortfall. Imported preparations can serve domestic sales, inventory or different production cycles and textile processing also uses locally supplied chemicals. The two trade baskets cannot be combined to calculate margins or value addition.
Read together, the reports bring the commercial challenge into focus: access to processing inputs is only one part of export competitiveness. The output data shows where sales held up and where momentum weakened. For India’s processors, the opportunity lies in building on resilient product lines while addressing the broader second-quarter slowdown.
Source: ITC calculations based on Directorate General of Commercial Intelligence & Statistics.
Disclaimer: Analysis covers selected dyed and printed fabric categories; destination figures cover a broader fabric basket. Readers are advised to cross-verify figures before making decisions.