COCPC Meeting Highlights Increased Cotton Consumption And Enhanced Traceability
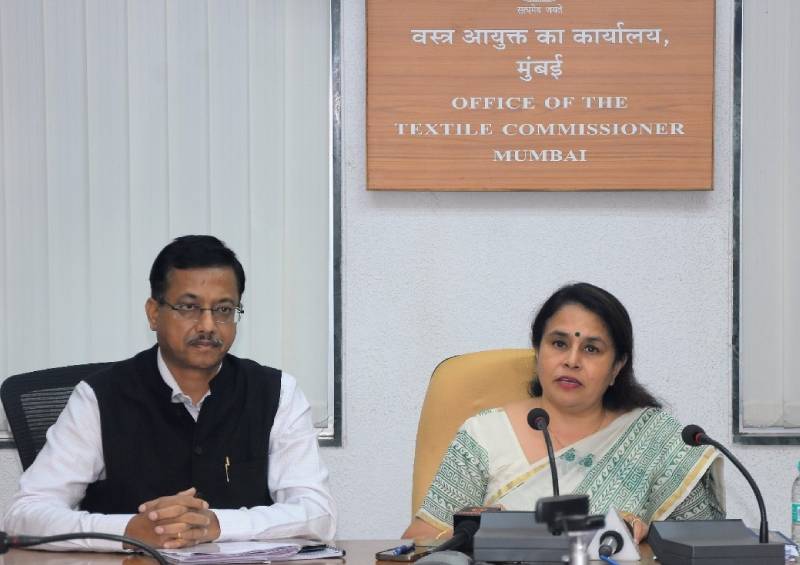
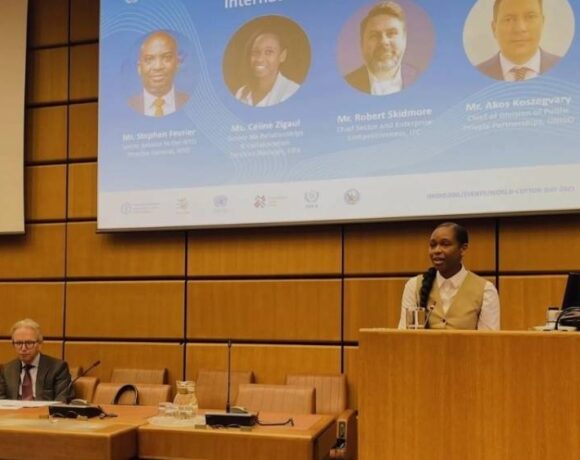
The third meeting of the Committee on Cotton Production and Consumption (COCPC) for the 2023-24 cotton season was held on June 24, 2024, under the chairpersonship of Textile Commissioner Roop Rashi. The meeting included representatives from the Central and State Governments, the textile industry, the cotton trade, and the ginning and pressing sectors. The committee discussed the state-wise area, production, import, export, and consumption of cotton.
In a post-meeting press conference, Roop Rashi assured that the industry would have sufficient raw material availability. She noted that cotton consumption has increased, marking the second-highest consumption in the past decade. “The industry is on a good path, and we look forward to better consumption statistics,” she stated.
Lalit Kumar Gupta, Chairman-cum-Managing Director of the Cotton Corporation of India (CCI) Ltd., announced the implementation of QR code traceability for each bale, providing detailed information on the village of procurement, processing factory, and date of sale.
Cotton Balance Sheet for the 2022-23 and 2023-24 Seasons (as of June 24, 2024)
| Particulars |
2022-23 |
2023-24 (P) |
||
| (In lakh bales of
170 kg. Each) |
(in Thousand
Tons) |
(In lakh bales of
170 kg. Each) |
(in Thousand
Tons) |
|
| SUPPLY | ||||
| Opening Stock | 39.48 | 671.16 | 61.16 | 1039.72 |
| Crop | 336.60 | 5722.20 | 325.22 | 5528.74 |
| Import | 14.60 | 248.20 | 12.00 | 204.00 |
| TOTAL SUPPLY | 390.68 | 6641.56 | 398.38 | 6772.46 |
| DEMAND | ||||
| Non-MSME Consumption | 197.80 | 3362.60 | 204.00 | 3468.00 |
| MSME Consumption | 99.83 | 1697.11 | 103.00 | 1751.00 |
| Non Textile Consumption | 16.00 | 272.00 | 16.00 | 272.00 |
| Export | 15.89 | 270.13 | 28.00 | 476.00 |
| TOTAL DEMAND | 329.52 | 5601.84 | 351.00 | 5967.00 |
| Closing Stock. | 61.16 | 1039.72 | 47.38 | 805.46 |
P-Provisional
State-Wise Area and Production Estimates for the 2022-23 and 2023-24 Cotton Seasons
Area: in Lakh Hectares
Production: in Lakh bales of 170 kg.
Yield: Kg per hectare
| State |
Area |
Production* |
Yield |
|||
| 2022-23 | 2023-24 (P) | 2022-23 | 2023-24 (P) | 2022-23 | 2023-24 (P) | |
| Punjab | 2.49 | 2.14 | 4.44 | 6.29 | 303.13 | 499.67 |
| Haryana | 5.75 | 5.78 | 10.01 | 15.09 | 295.95 | 443.82 |
| Rajasthan | 8.15 | 10.04 | 27.74 | 26.22 | 578.63 | 443.96 |
| Total North Zone | 16.39 | 17.96 | 42.19 | 47.60 | 437.60 | 450.56 |
| Gujarat | 24.84 | 26.83 | 87.95 | 90.60 | 601.91 | 574.06 |
| Maharashtra | 41.82 | 42.34 | 83.16 | 80.45 | 338.05 | 323.02 |
| Madhya Pradesh | 5.95 | 6.30 | 14.33 | 18.01 | 409.43 | 485.98 |
| Total Central Zone | 72.61 | 75.47 | 185.44 | 189.06 | 434.17 | 425.87 |
| Telangana | 19.73 | 18.18 | 57.45 | 50.80 | 495.01 | 475.03 |
| Andhra Pradesh | 7.04 | 4.22 | 15.41 | 7.25 | 372.12 | 292.06 |
| Karnataka | 9.49 | 7.39 | 25.68 | 20.47 | 460.02 | 470.89 |
| Tamil Nadu | 1.73 | 1.30 | 3.19 | 2.78 | 313.47 | 363.54 |
| Total South Zone | 37.99 | 31.09 | 101.73 | 81.30 | 455.23 | 444.55 |
| Odisha | 2.16 | 2.16 | 7.05 | 7.05 | 554.86 | 554.86 |
| Others | 0.12 | 0.12 | 0.19 | 0.21 | 269.17 | 297.50 |
| All-India | 129.27 | 126.80 | 336.60 | 325.22 | 442.65 | 436.02 |
P= Provisional
* – Including state-wise loose cotton production